Did you know that you can navigate the posts by swiping left and right?
MTA Turnstile Data Analysis
18 Jul 2016
. category:
Projects
.
Comments
#Project
#Tech
#Python
#Pandas
#EDA
#matplotlib
#MTA
#Turnstile
MTA Turnstile Data Analysis
For this blog post, I wanted to use a concept I had learned awhile back that may help fellow data scientists explain their project workflow coherently and succintly. It’s called the S.T.A.R method, which is an acronym that stands for:
- Situation
- Task
- Action
- Result
I cannot count the number of times that I’ve used this method in interviews to help me describe problems that I’ve solved while hitting on the major points of the project.
Read more about the S.T.A.R technique here
Situation: For the situation, we were given the link to New York’s Subay MTA Turnstile Data. and pretty much free reign as to how to analyze the data and make sense of it visually.
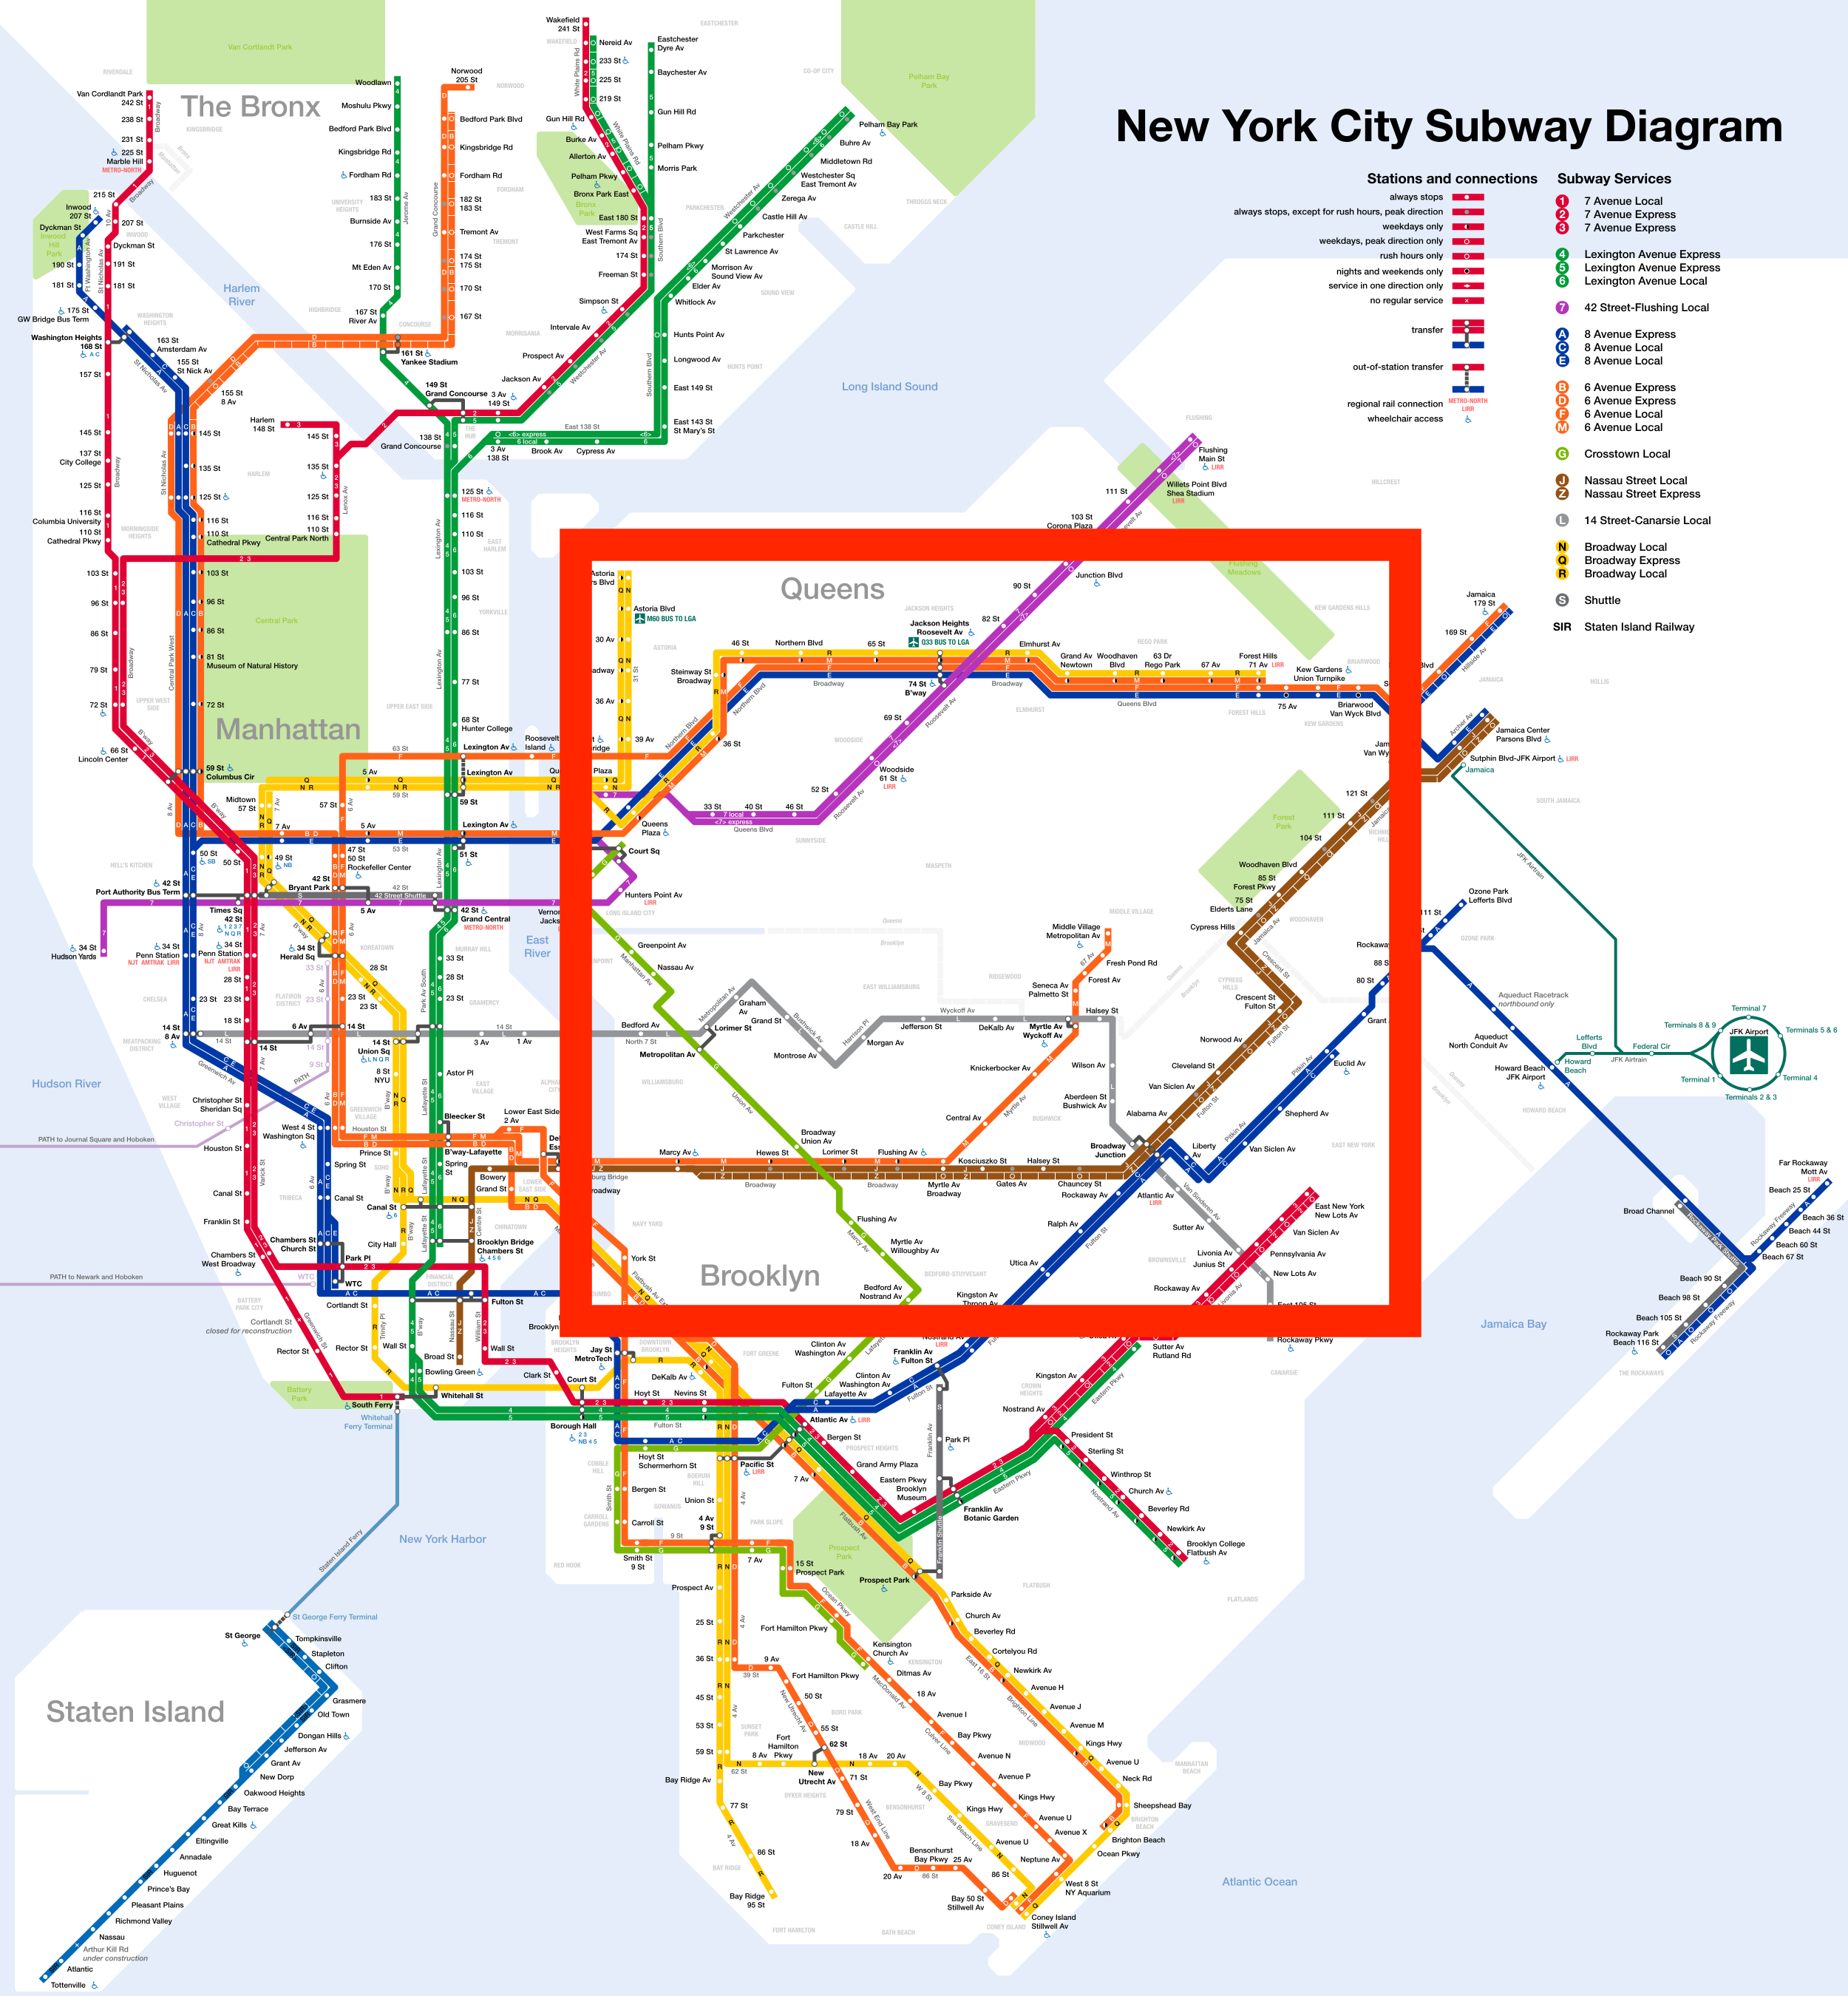
Task: My team and I reviewed the map and noticed that there was a gap between Queens and Brooklyn where the MTA Subway tracks didn’t really travel (see figure 1 below). For commuters who wanted to travel between those two areas using the Subway, they would have to take a rather long roundabout way that would increase their daily commute time.
Figure 1 : New York Subway Station Map
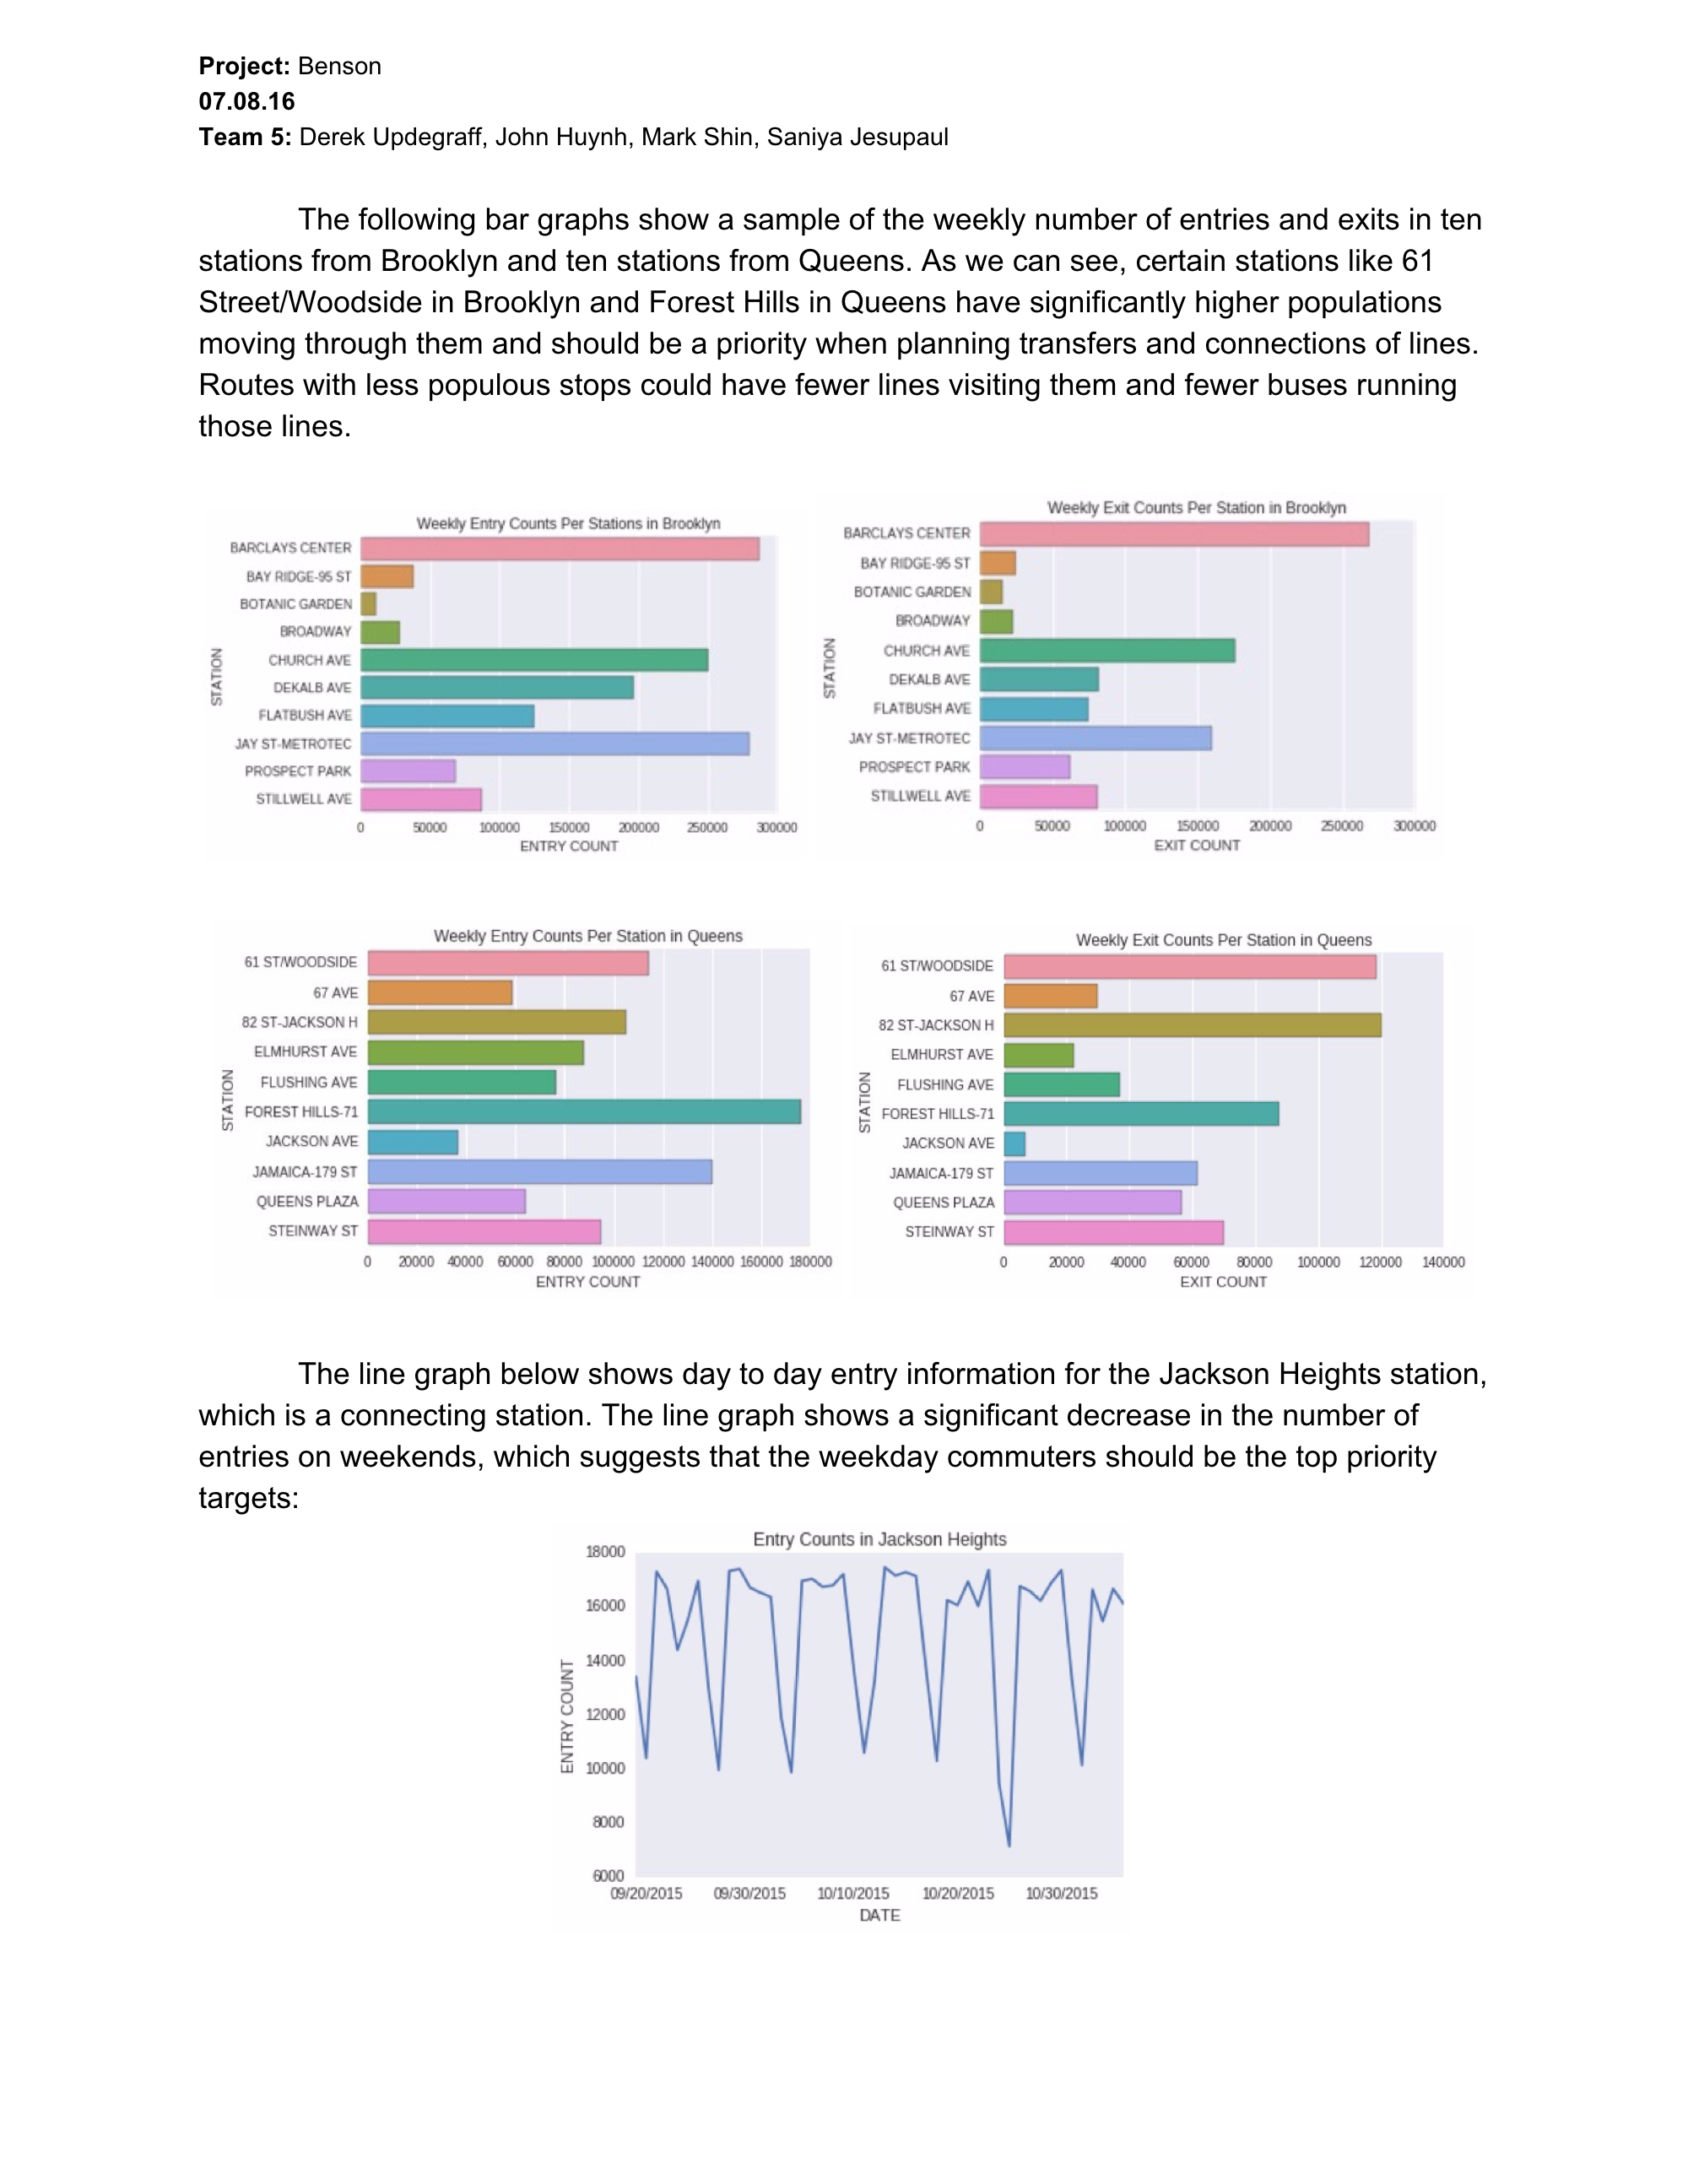
Action: We decided to create a fictional startup named Qubra that had just recently acquired shuttles and buses. This business was looking for consultants who could help maximize the potential of their recently acquired vehicles. After writing the business a preliminary analysis (Sample page in Figure 2), we thought that it would be a good choice for the business to set up shuttles that could take commuters directly from Brooklyn to Queens (or vice versa) at the points that totaled the most foot traffic.
Figure 2 : Sample page from the Client Report
Since the data needed cleaning, I was tasked with not only munging/cleaning it but also creating the intial code that would calculate the totals of each station per day. (See code snippet in Figure 3). After completing this step, I also decided to plot some of the data to see if any patterns stood out.
From there, my teammates and I wrote additional code to handle edge cases and also worked together to plot the data using seaborn and matplotlib.
Figure 3 : Imports we used and some code regarding the calculations. To view the Jupyter notebook, click here
import pandas as pd
import seaborn as sns
import matplotlib.pyplot as plt
import pprint
import glob
%matplotlib inline

list_of_files = []
for filename in glob.glob("turnstile_*.txt"):
    list_of_files.append(filename)

df = pd.concat(pd.read_csv(file) for file in list_of_files)

df.columns = df.columns.str.strip()

df_entries = df.groupby(['STATION','UNIT','C/A','SCP','DATE'], as_index=False)['ENTRIES'].min()
df_entries['NEXT_DAY_ENTRIES'] = df_entries['ENTRIES']
df_entries.NEXT_DAY_ENTRIES = df_entries.NEXT_DAY_ENTRIES.shift(-1)
df_entries['ENTRY_COUNT'] = df_entries['NEXT_DAY_ENTRIES'] - df_entries['ENTRIES']
df_entries = df_entries[(df_entries.ENTRY_COUNT > 0) & (df_entries.ENTRY_COUNT < 200000)]
df_entries = df_entries.groupby(['STATION','DATE'], as_index=False)['ENTRY_COUNT'].sum()
df_entries = df_entries[df_entries.DATE != "11/06/2015"]
Results:
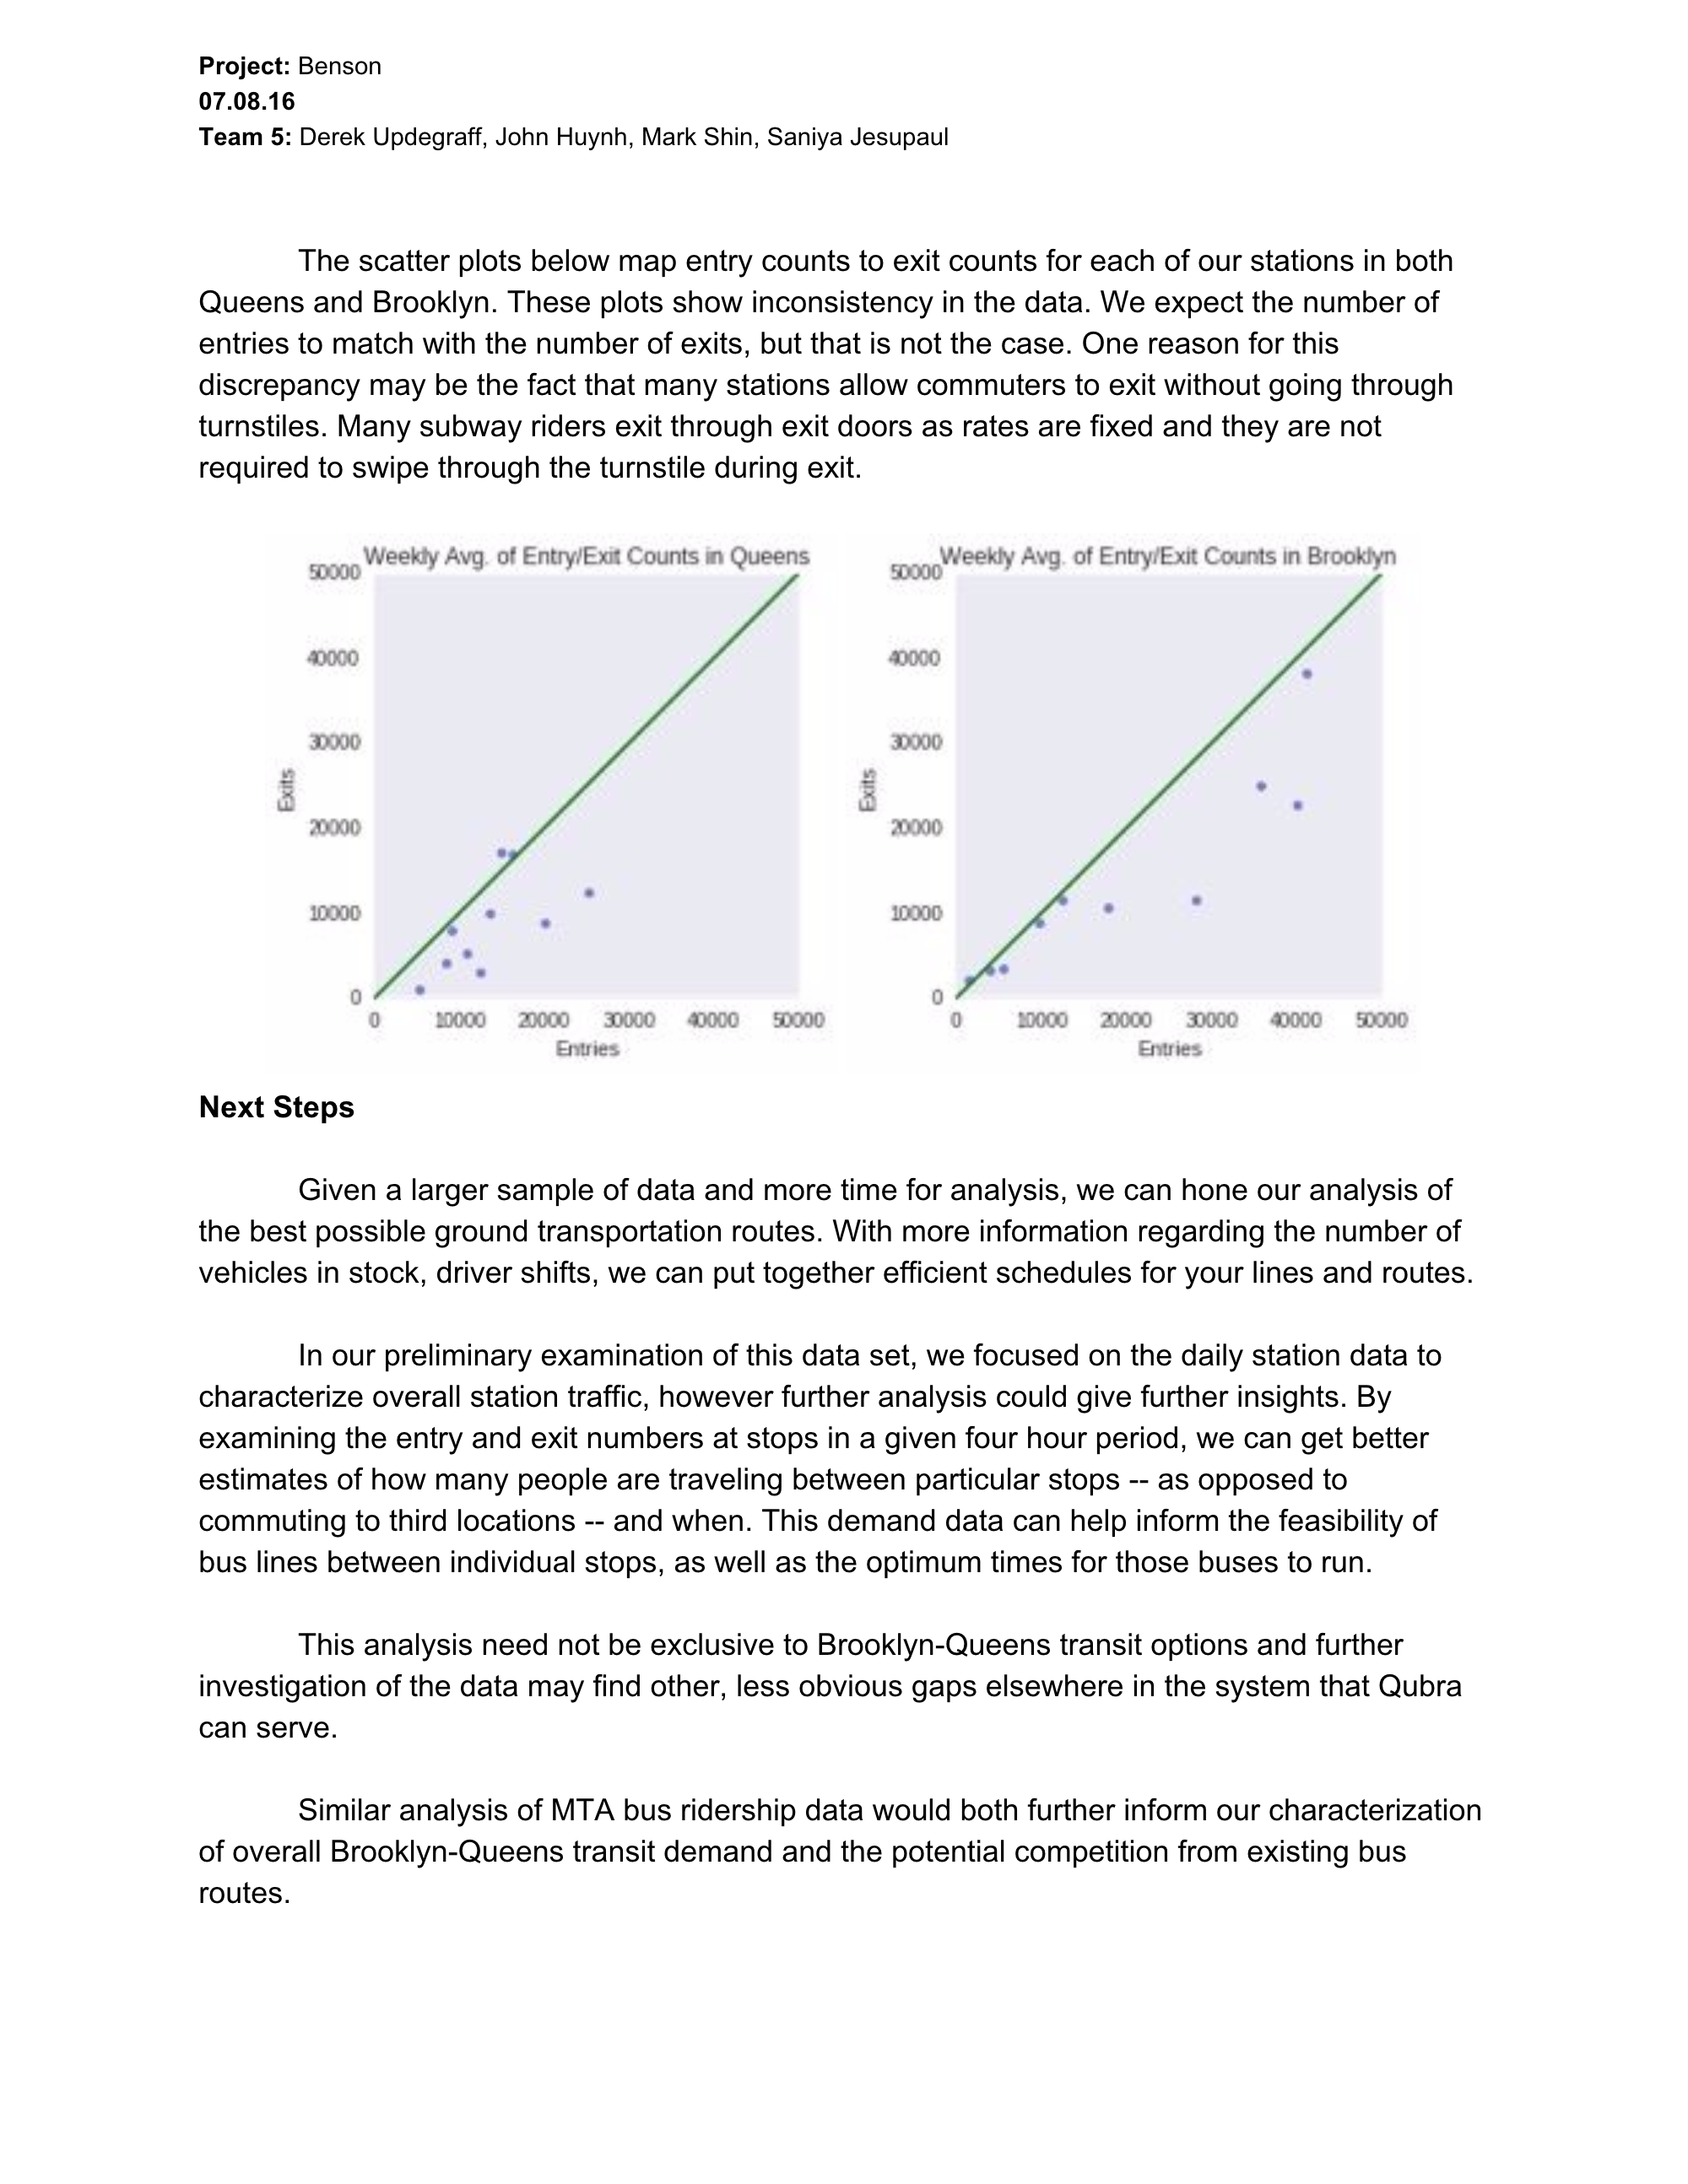
On Friday, we completed the finishing touches on the calculations and placed all of that into a iPython notebook for submission. We also created a powerpoint and proposal document, which we gave a presentation on to the whole class(See a sample page on Figure 4). Our final solution not only provided the client with potential stations that handled lots of foot traffic, but also specific times in which they should schedule their shuttle for pick-ups/drop-offs.
Figure 4 : Final page taken from our proposal document
TL:DR Overall, I was extremely pleased with the final product of my first project. My teammates were a joy to work with, and I really can’t wait to start my next project!

John Huynh is an awesome person. He lives in San Francisco, where he works on data science projects. In his spare time, John likes to eat chipotle.